
Data-Driven Decisions: Why Your Company Needs a Custom Dashboard
Most important decisions in a company are made with incomplete information. Not for lack of data — more is generated today than ever — but because that data is scattered, outdated and in formats no one can read quickly. When the monthly sales report arrives on the 10th of the following month, it’s no longer useful for deciding: it’s only useful for regretting.
Business Intelligence (BI) exists to close that gap. And the most visible BI tool is the dashboard: a screen where your business’s key numbers update themselves and tell you, at a glance, how your company is doing. In this article we explain why a custom dashboard can be one of the highest-return investments for an owner or director.
The cost of deciding blind
Operating without real-time visibility has consequences that are rarely accounted for, but always felt:
- You react late: you find out a product stopped selling or a customer left when it’s already hard to reverse.
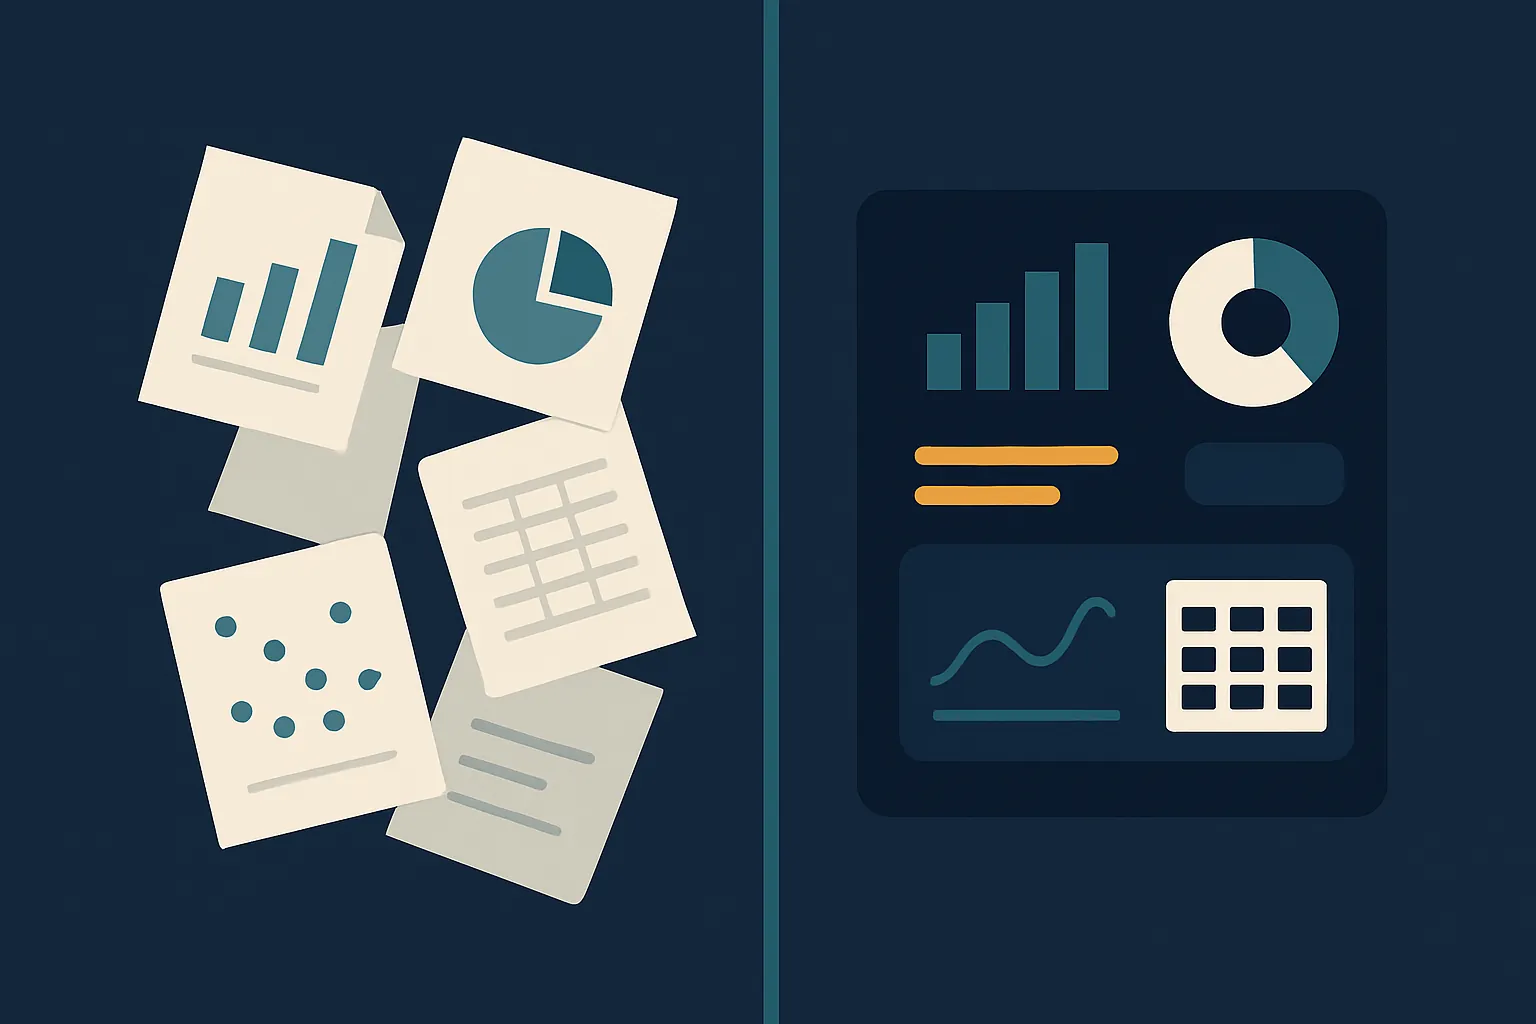
- You argue about versions, not decisions: each department keeps its own spreadsheet, and meetings are spent reconciling numbers instead of acting.
- You depend on a few people: only one person knows how to pull that report, and when they’re out, you’re blind.
What a BI dashboard actually does
A good dashboard is not a prettier spreadsheet. It is a system that gathers data from all your sources, processes it and presents it as actionable indicators, updating automatically. Its core functions:
- Centralizes: connects your ERP, CRM, point of sale, online store and databases into a single view.
- Summarizes: turns thousands of records into the few indicators (KPIs) that truly matter for your business.
- Alerts: tells you when something is off — low inventory, a sales drop, a customer at risk — without you having to go looking.
- Drills down: lets you go from the headline number to the detail in one click, to understand the why behind the figure.
Why custom and not a generic template
There are very powerful off-the-shelf BI tools. They work well when your indicators are standard. The problem appears with the metrics that truly reflect your business: your way of calculating margin, your definition of an active customer, your particular channel mix.
A custom dashboard is built around those rules:
- It shows your KPIs, not generic ones: the indicators your leadership actually uses to decide.
- It connects to what you already have: it relies on integrating your systems so data flows on its own, without re-entry.
- It grows with you: you add new metrics and sources as your business evolves.
From dashboard to forecast: the role of AI
A traditional dashboard tells you what happened. The next level is anticipating what will happen. By adding artificial intelligence on top of your centralized data, the system stops merely reporting and starts to:
- Predict: estimate demand, revenue or customer churn risk.
- Detect patterns: find relationships a human wouldn’t see across thousands of records.
- Recommend: suggest the next action — restock, contact a customer, adjust a price — at the right moment.
But all of this depends on a solid foundation: reliable, connected data. That’s why a well-built dashboard is also the first step toward an operation that decides with intelligence.
Where to start
You don’t need a giant project to start seeing clearly:
- Define your 5 to 8 key KPIs: which numbers would you look at every morning to know if the business is doing well?
- Identify where that data lives today and how hard it is to get.
- Build a first dashboard with those indicators, connect it to your sources and let it update itself.
From there, the dashboard grows naturally as new questions arise.
At Kimo Solutions we design and build custom dashboards and Business Intelligence solutions, connected to your systems, so you can run your company on real-time data instead of gut feeling.
Want to see your whole business on a single screen? Contact us and let’s design the dashboard your leadership needs.
Have a project in mind?
Get in touch →